Backed by
Combinator
Stop shipping
blind.
Ship at agent speed. OnePatch instruments your stack, verifies every PR in prod, and fixes what breaks.
Ship at agent speed. OnePatch instruments your stack, verifies every PR in prod, and fixes what breaks.

OnePatch
OnePatch
OnePatch
Home
Home
Home
Pull Requests
Pull Requests
Pull Requests
Monitors
Monitors
Monitors
Dashboards
Dashboards
Dashboards
Threads
Threads
Threads
65
65
65
New thread
New thread
New thread
Recent
Recent
Recent
Gmail database slowdown
Gmail database slowdown
Gmail database slowdown
Members page latency
Members page latency
Members page latency
Phone monitoring gap
Phone monitoring gap
Phone monitoring gap
Incidents
Incidents
Incidents
Search Incidents...
Search Incidents...
Search Incidents...
Filter
Filter
Filter

Built for fast-moving
engineering teams
The Problem
The Problem
Teams ship in seconds. Finding failures takes hours.

Teams ship dozens of PRs daily, but visibility lags behind. Dependencies fail silently, and the first alert is often a breached SLO or an angry customer ping.

When production breaks, context is split across logs, traces, dashboards, and Slack. Engineers spend critical hours hunting signals instead of shipping a fix.

The faster your team deploys code, the harder it is to understand actual state. Velocity outpaces clarity, leaving teams running blind in critical moments.
Teams ship dozens of PRs daily, but visibility lags behind. Dependencies fail silently, and the first alert is often a breached SLO or an angry customer ping.
When production breaks, context is split across logs, traces, dashboards, and Slack. Engineers spend critical hours hunting signals instead of shipping a fix.
The faster your team deploys code, the harder it is to understand actual state. Velocity outpaces clarity, leaving teams running blind in critical moments.
Capabilities
Capabilities
Moving at agent speed.
Keeping production in sight.

[01] Agent PRs
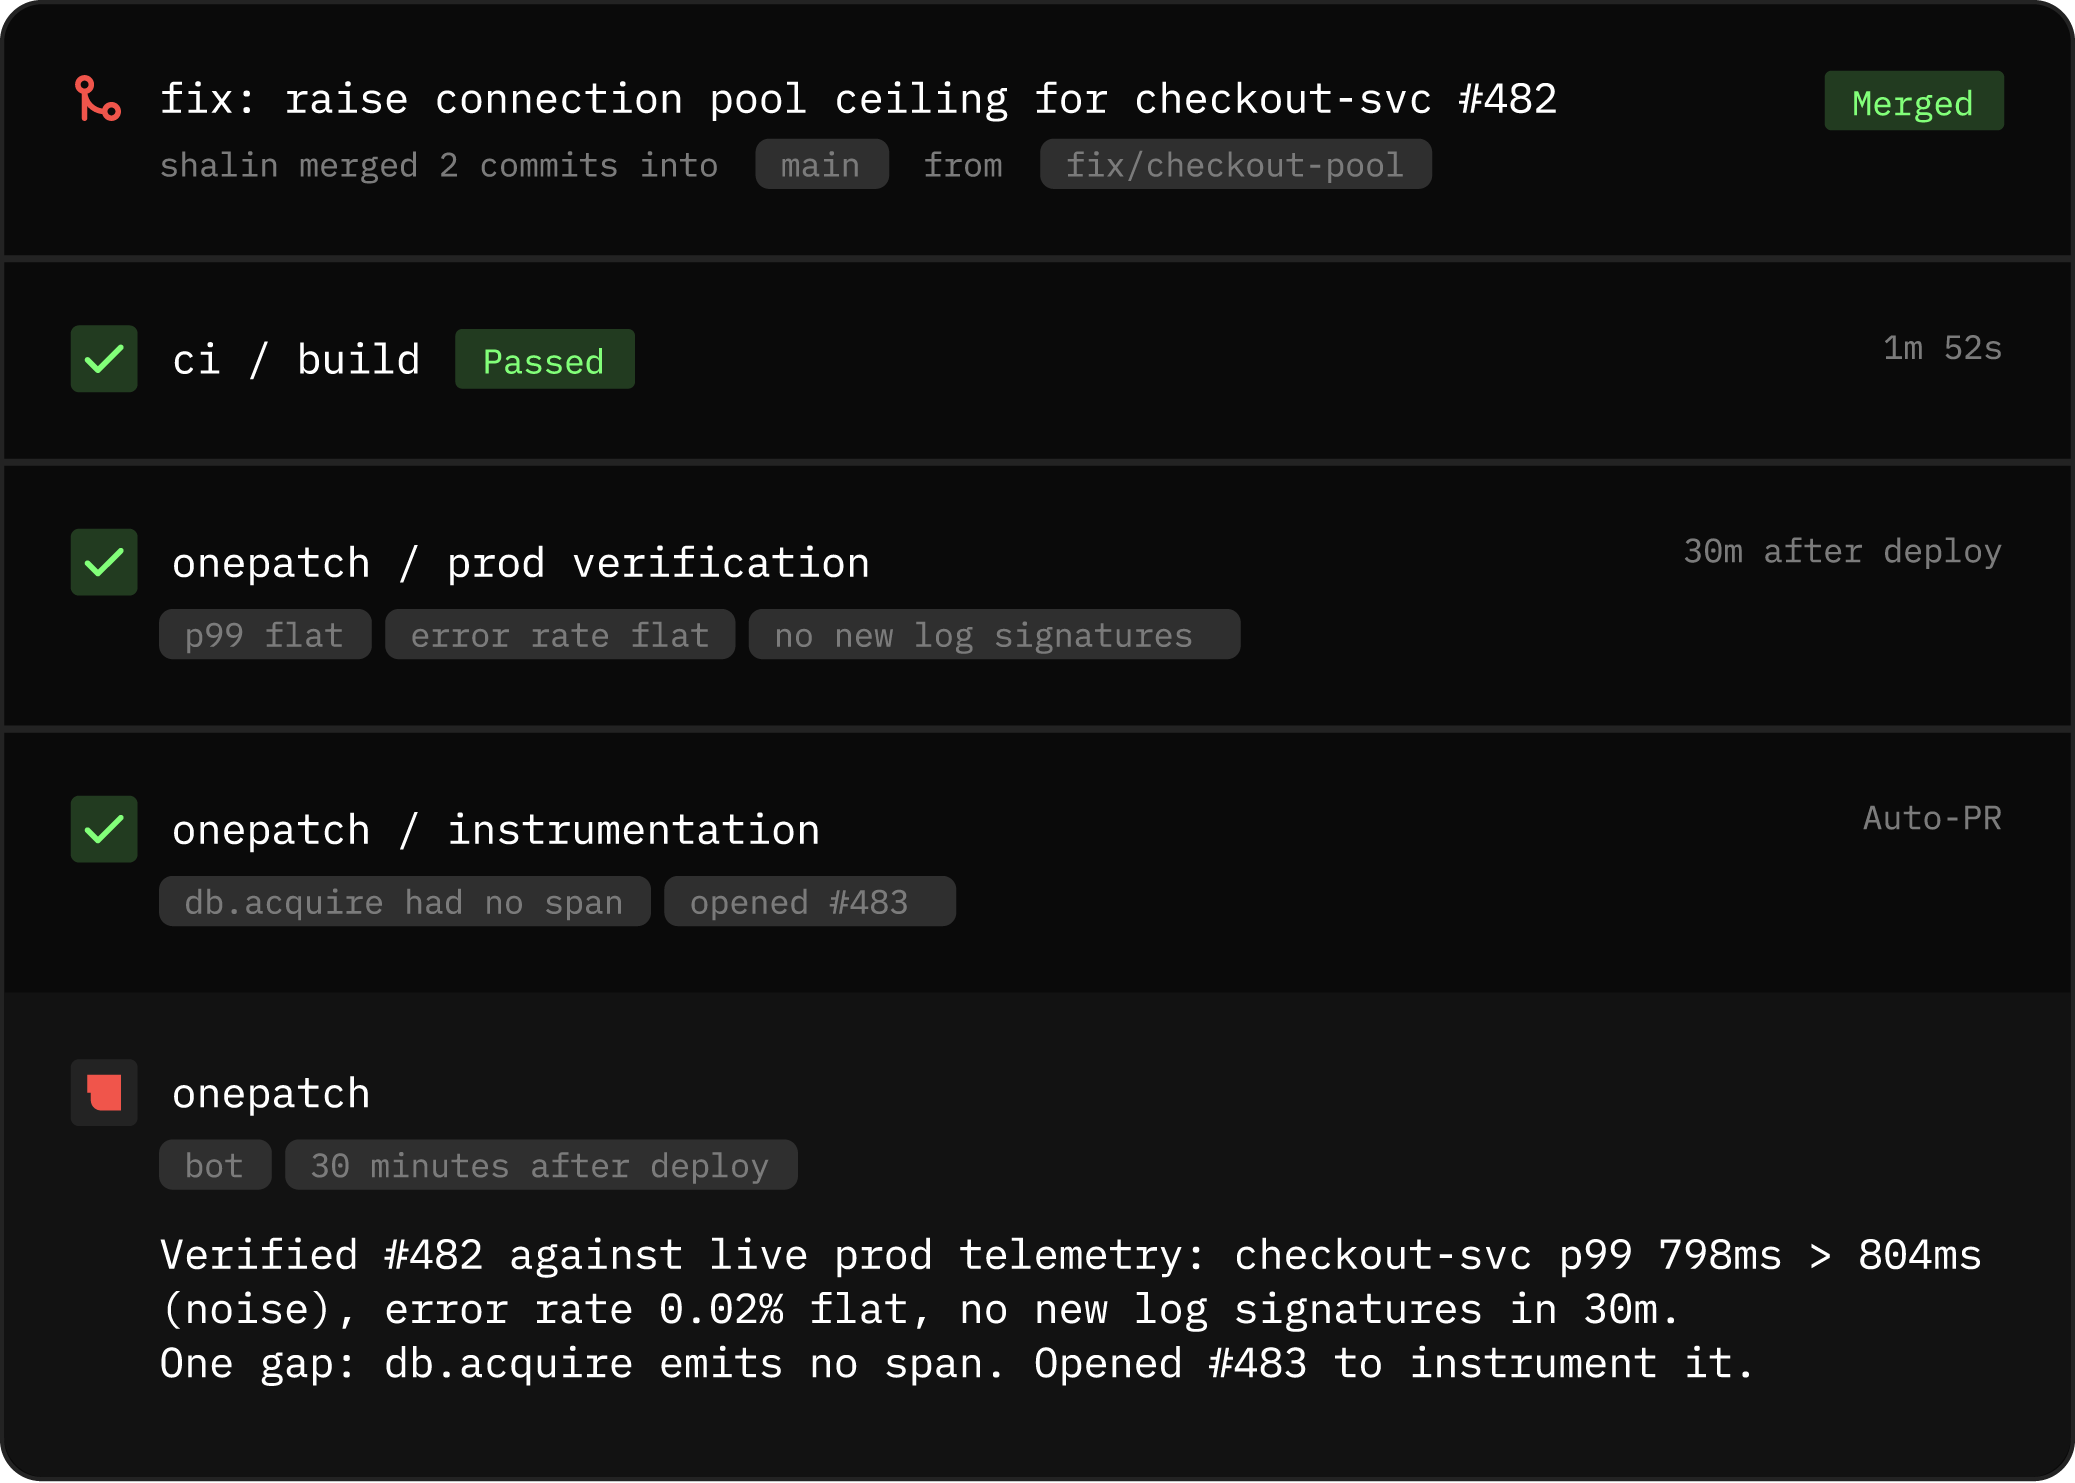
Every PR verified in prod.
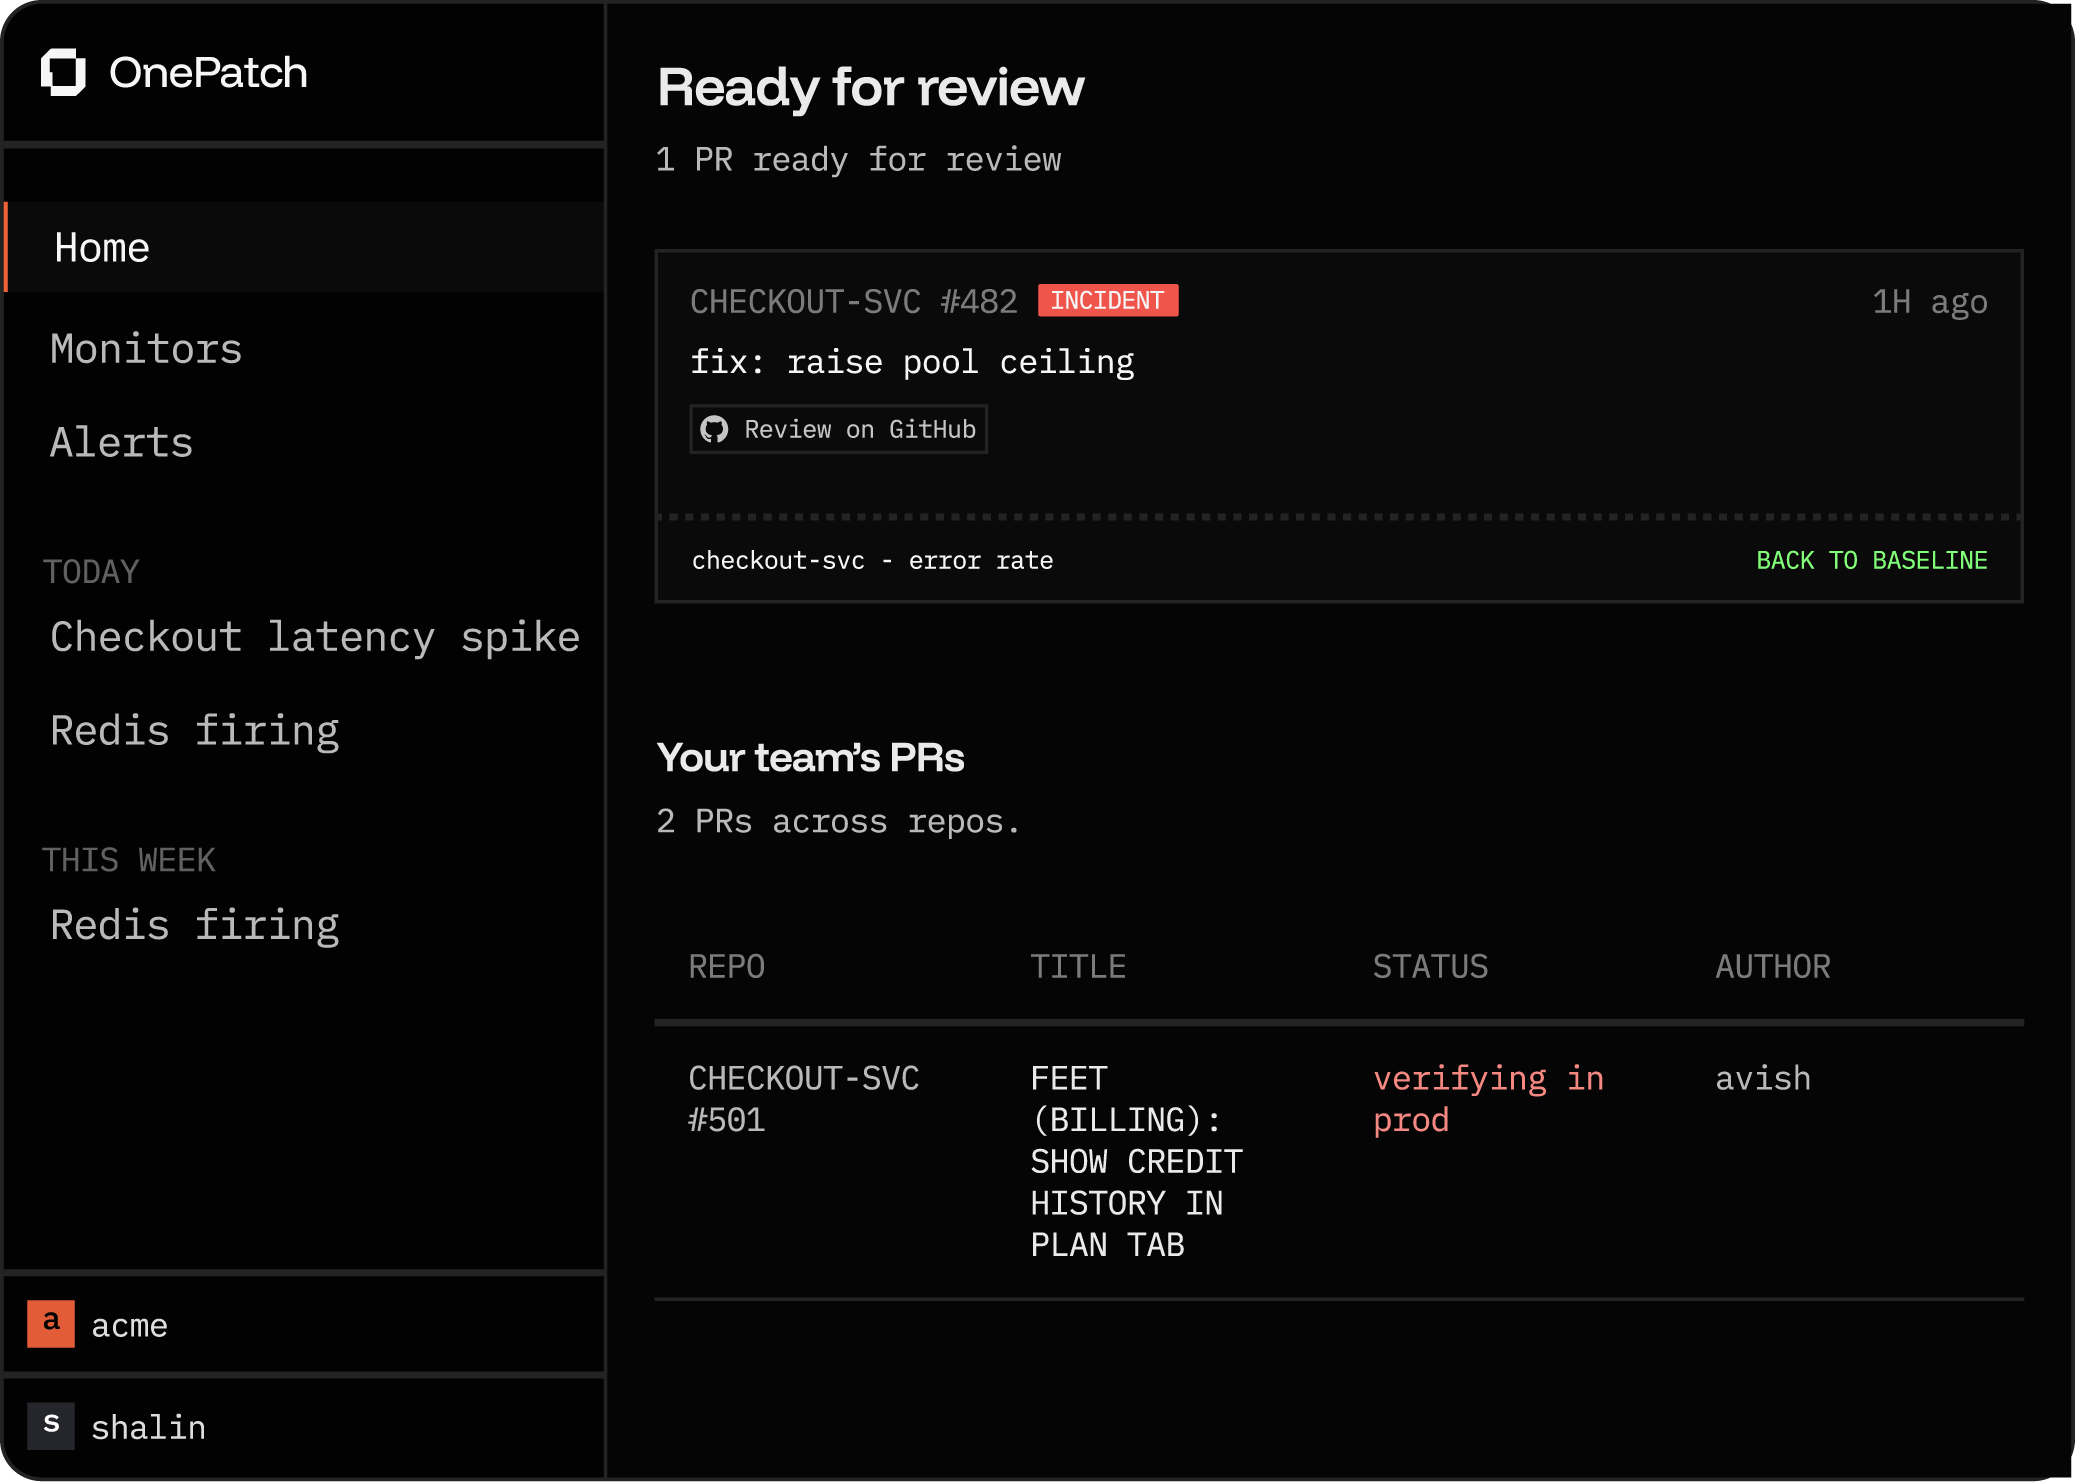
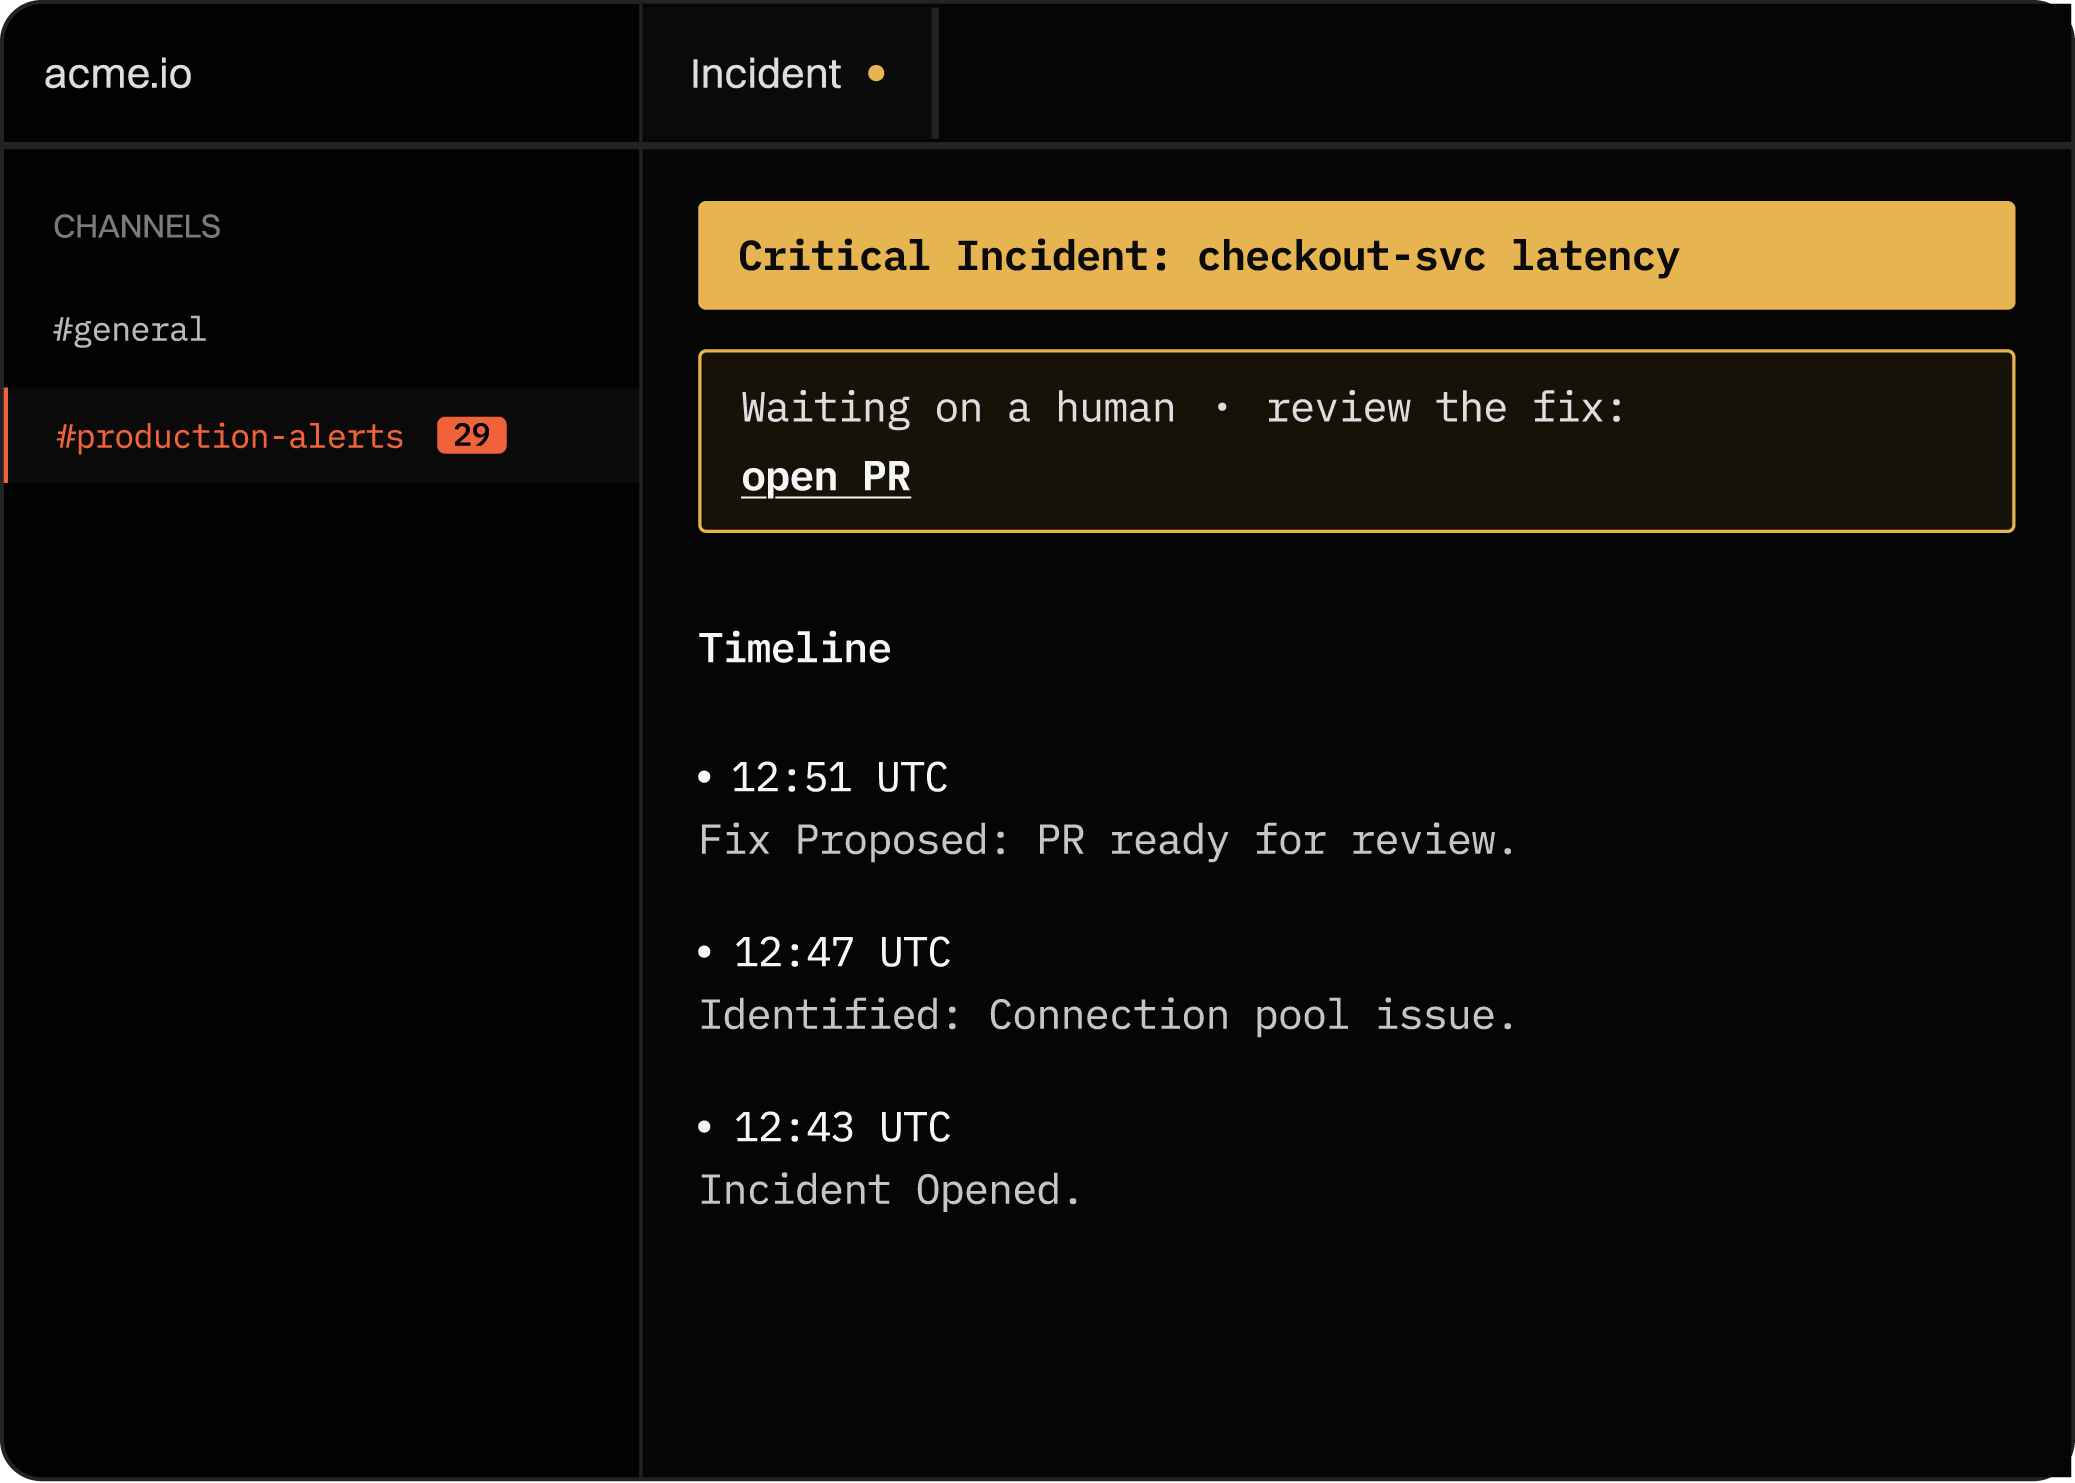
OnePatch verifies every pull request against live production telemetry. It proactively instruments any gaps in your observability before they can turn into blind spots.
[02] Incidents caught
The alert that matters is buried.
[03] Tool sprawl
Stitching it together kills the SLO.
[01] Agent PRs
Every PR verified in prod.
OnePatch verifies every pull request against live production telemetry. It proactively instruments any gaps in your observability before they can turn into blind spots.
[02] Incidents caught
[03] Tool sprawl
[01] Agent PRs
Every PR verified in prod.
OnePatch verifies every pull request against live production telemetry. It proactively instruments any gaps in your observability before they can turn into blind spots.
[02] Incidents caught
[03] Tool sprawl
Integrations & Compatibility
Integrations & Compatibility
Native to your stack. Extensible via MCP.
Native to your stack. Extensible via MCP.
Native to your stack. Extensible via MCP.
Grant OnePatch secure, read-only access to your existing cloud providers and MCP servers to unify your telemetry without ever modifying your infrastructure.
Grant OnePatch secure, read-only access to your existing cloud providers and MCP servers to unify your telemetry without ever modifying your infrastructure.
Grant OnePatch secure, read-only access to your existing cloud providers and MCP servers to unify your telemetry without ever modifying your infrastructure.

Installation
Installation
Connect once.
OnePatch handles the rest.
Learn from production
As telemetry flows, the agent learns how your services behave in production and creates monitors and dashboards, so incidents are caught minutes after they start, not after a customer complains.
Connect GitHub and Slack
Connect your GitHub and Slack, then choose the repos to monitor and the channel where alerts should land.
Instrument your repo
The agent instruments your repo with OpenTelemetry and points the stream at us. Review, merge, and deploy that one PR.
Learn from production
As telemetry flows, the agent learns how your services behave in production and creates monitors and dashboards, so incidents are caught minutes after they start, not after a customer complains.
1
2
3
Learn from production
As telemetry flows, the agent learns how your services behave in production and creates monitors and dashboards, so incidents are caught minutes after they start, not after a customer complains.
Connect GitHub and Slack
Connect your GitHub and Slack, then choose the repos to monitor and the channel where alerts should land.
Invoke the OnePatch skill where you already code
The agent instruments your repo with OpenTelemetry and points the stream at us. Review, merge, and deploy that one PR.
Learn from production
As telemetry flows, the agent learns how your services behave in production and creates monitors and dashboards, so incidents are caught minutes after they start, not after a customer complains.
1
2
3
■
■
■
■
■
■
■
■
Pricing
Pricing
Transparent economics.
Starter
$500
/ per month
Just starting out

25 Conclusive Investigations included
$20 per additional investigation
Scale
$2,000
/ per month
Growing fast
100 Conclusive Investigations included
$10 per additional investigation
Enterprise
Custom
/ Pricing
Custom deployment and dedicated support
Volume investigation discounts
Dedicated success engineer
Starter
$500
/ per month
Just starting out
25 Conclusive Investigations included
$20 per additional investigation
Scale
$2,000
/ per month
Growing fast
100 Conclusive Investigations included
$10 per additional investigation
Enterprise
Custom
/ Pricing
Custom deployment and dedicated support
Volume investigation discounts
Dedicated success engineer
Starter
$500
/ per month
Just starting out
25 Conclusive Investigations included
$20 per additional investigation
Scale
$2,000
/ per month
Growing fast
100 Conclusive Investigations included
$10 per additional investigation
Enterprise
Custom
/ Pricing
Custom deployment and dedicated support
Volume investigation discounts
Dedicated success engineer
Starter
$500
/ per month
Just starting out
25 Conclusive Investigations included
$20 per additional investigation
Scale
$2,000
/ per month
Growing fast
100 Conclusive Investigations included
$10 per additional investigation
Enterprise
Custom
/ Pricing
Custom scale and dedicated support.
Volume investigation discounts
Dedicated success engineer
FAQs
FAQs
Frequently asked questions
Frequently asked questions
[01]
What counts as a conclusive investigation?

[01]
There are multiple entry points in which the OnePatch Agent will launch an investigation: The OnePatch Chat UI, Slack bot, MCP, or CLI. A monitor alert firing that launches an incident. Alerts that resolve on their own are never counted.

[02]
Will it page me at 3am for noise?
[03]
Does it ever touch production?
[04]
Can I keep Datadog or Grafana?
[05]
What access does it need, and where does my data live?
[01]
What counts as a conclusive investigation?
[01]
There are multiple entry points in which the OnePatch Agent will launch an investigation: The OnePatch Chat UI, Slack bot, MCP, or CLI. A monitor alert firing that launches an incident. Alerts that resolve on their own are never counted.
[02]
Will it page me at 3am for noise?
[03]
Does it ever touch production?
[04]
Can I keep Datadog or Grafana?
[05]
What access does it need, and where does my data live?
[01]
What counts as a conclusive investigation?
[01]
There are multiple entry points in which the OnePatch Agent will launch an investigation: The OnePatch Chat UI, Slack bot, MCP, or CLI. A monitor alert firing that launches an incident. Alerts that resolve on their own are never counted.
[02]
Will it page me at 3am for noise?
[03]
Does it ever touch production?
[04]
Can I keep Datadog or Grafana?
[05]
What access does it need, and where does my data live?
Production reliability
on autopilot.
OnePatch watches what you ship, catches what breaks, and helps fix it.
Production reliability
on autopilot.
OnePatch watches what you ship, catches what breaks, and helps fix it.
Production reliability
on autopilot.
OnePatch watches what you ship, catches what breaks, and helps fix it.
Production reliability
on autopilot.
OnePatch watches what you ship, catches what breaks, and helps fix it.
Company
Connect

©2026 OnePatch
Company
Connect
©2026 OnePatch
Company
Connect
©2026 OnePatch
Company
©2026 OnePatch